Impedance plotting
-
Hello,
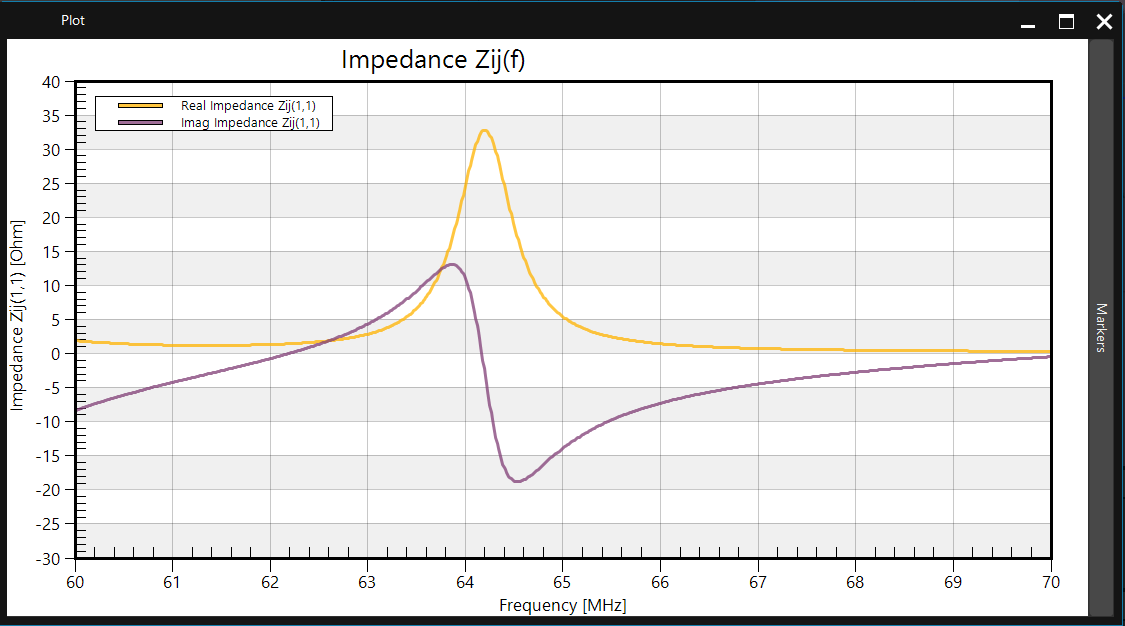
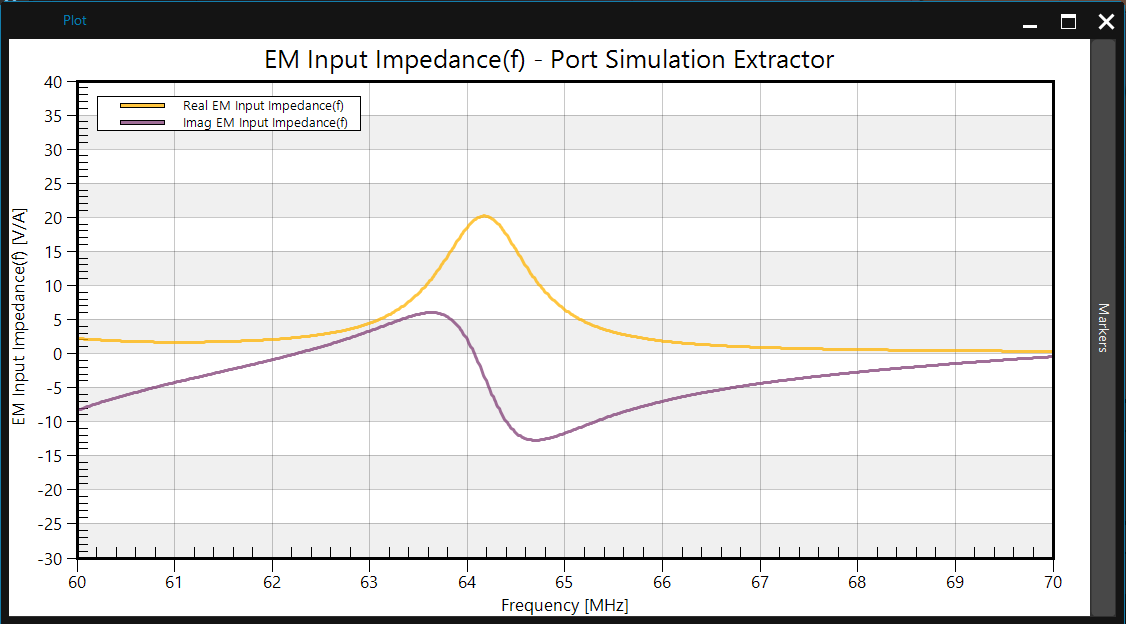
I'm working on a multiport simulation of a birdcage coil. I've done a few simulations already, but there's something I don't understand. I am using a high pass birdcage coil with two endring sources. I created a 2D impedance plot (Impedance Zij(f)) by clicking on Network Analysis – S Converter – Impedance Zij and then tried to create this plot by clicking on one of the sources by selecting Port Simulation Extractor-Sensor Extractor-EM Input Impedance(f). I thought that these two plots should look the same, but they don't, so I would like to ask for some clarification… Why are these two plots different? Am I missing something or is it some problem within my simulation?
Thanks in advance.
-
Hello,
I'm working on a multiport simulation of a birdcage coil. I've done a few simulations already, but there's something I don't understand. I am using a high pass birdcage coil with two endring sources. I created a 2D impedance plot (Impedance Zij(f)) by clicking on Network Analysis – S Converter – Impedance Zij and then tried to create this plot by clicking on one of the sources by selecting Port Simulation Extractor-Sensor Extractor-EM Input Impedance(f). I thought that these two plots should look the same, but they don't, so I would like to ask for some clarification… Why are these two plots different? Am I missing something or is it some problem within my simulation?
Thanks in advance.
Dear @Michael-0
Please refer to books like Microwave Engineering by Pozar. The impedance matrix is defined as shown in the attached figure (from Pozar) and
Z_iiis the input impedance seen looking into port i when all other ports are open-circuited.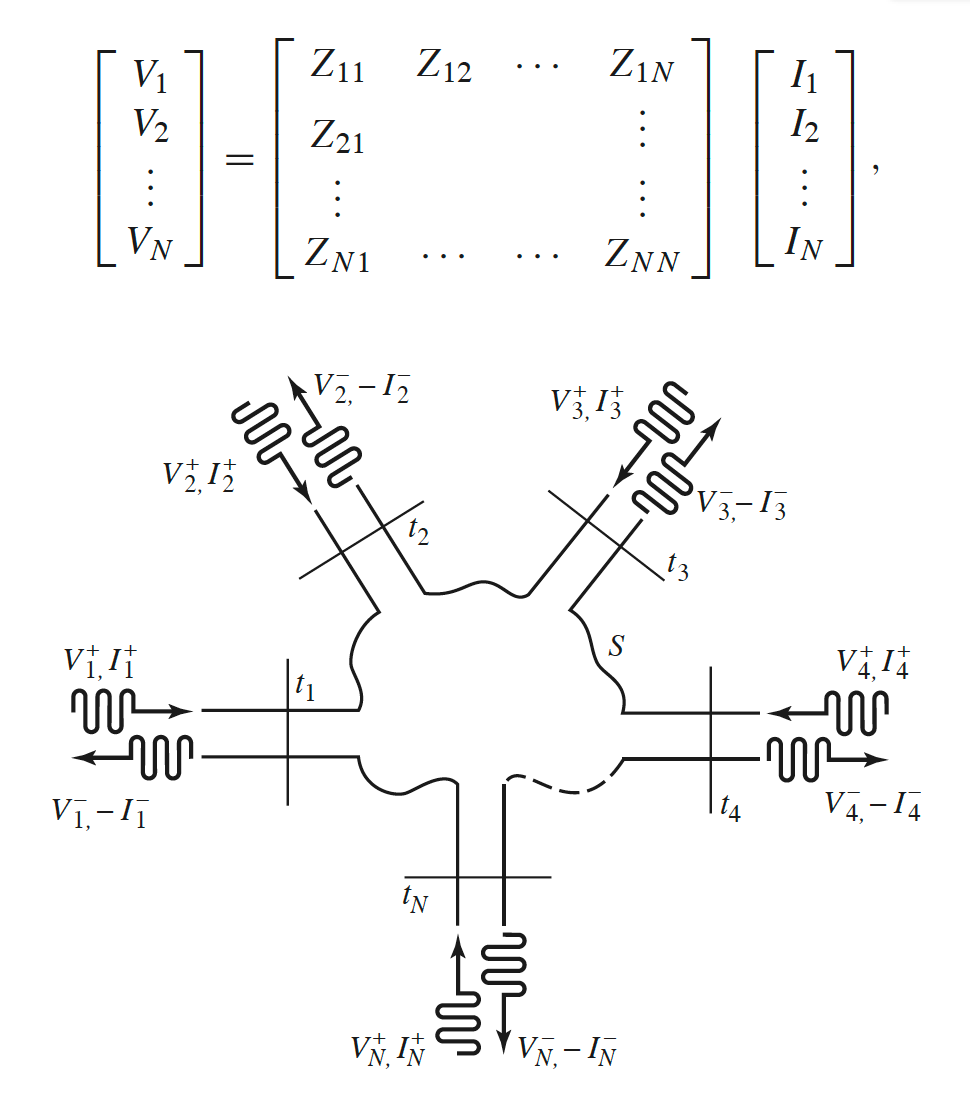

Hello! It looks like you're interested in this conversation, but you don't have an account yet.
Getting fed up of having to scroll through the same posts each visit? When you register for an account, you'll always come back to exactly where you were before, and choose to be notified of new replies (either via email, or push notification). You'll also be able to save bookmarks and upvote posts to show your appreciation to other community members.
With your input, this post could be even better 💗
Register Login