Error in TI tutorial
-
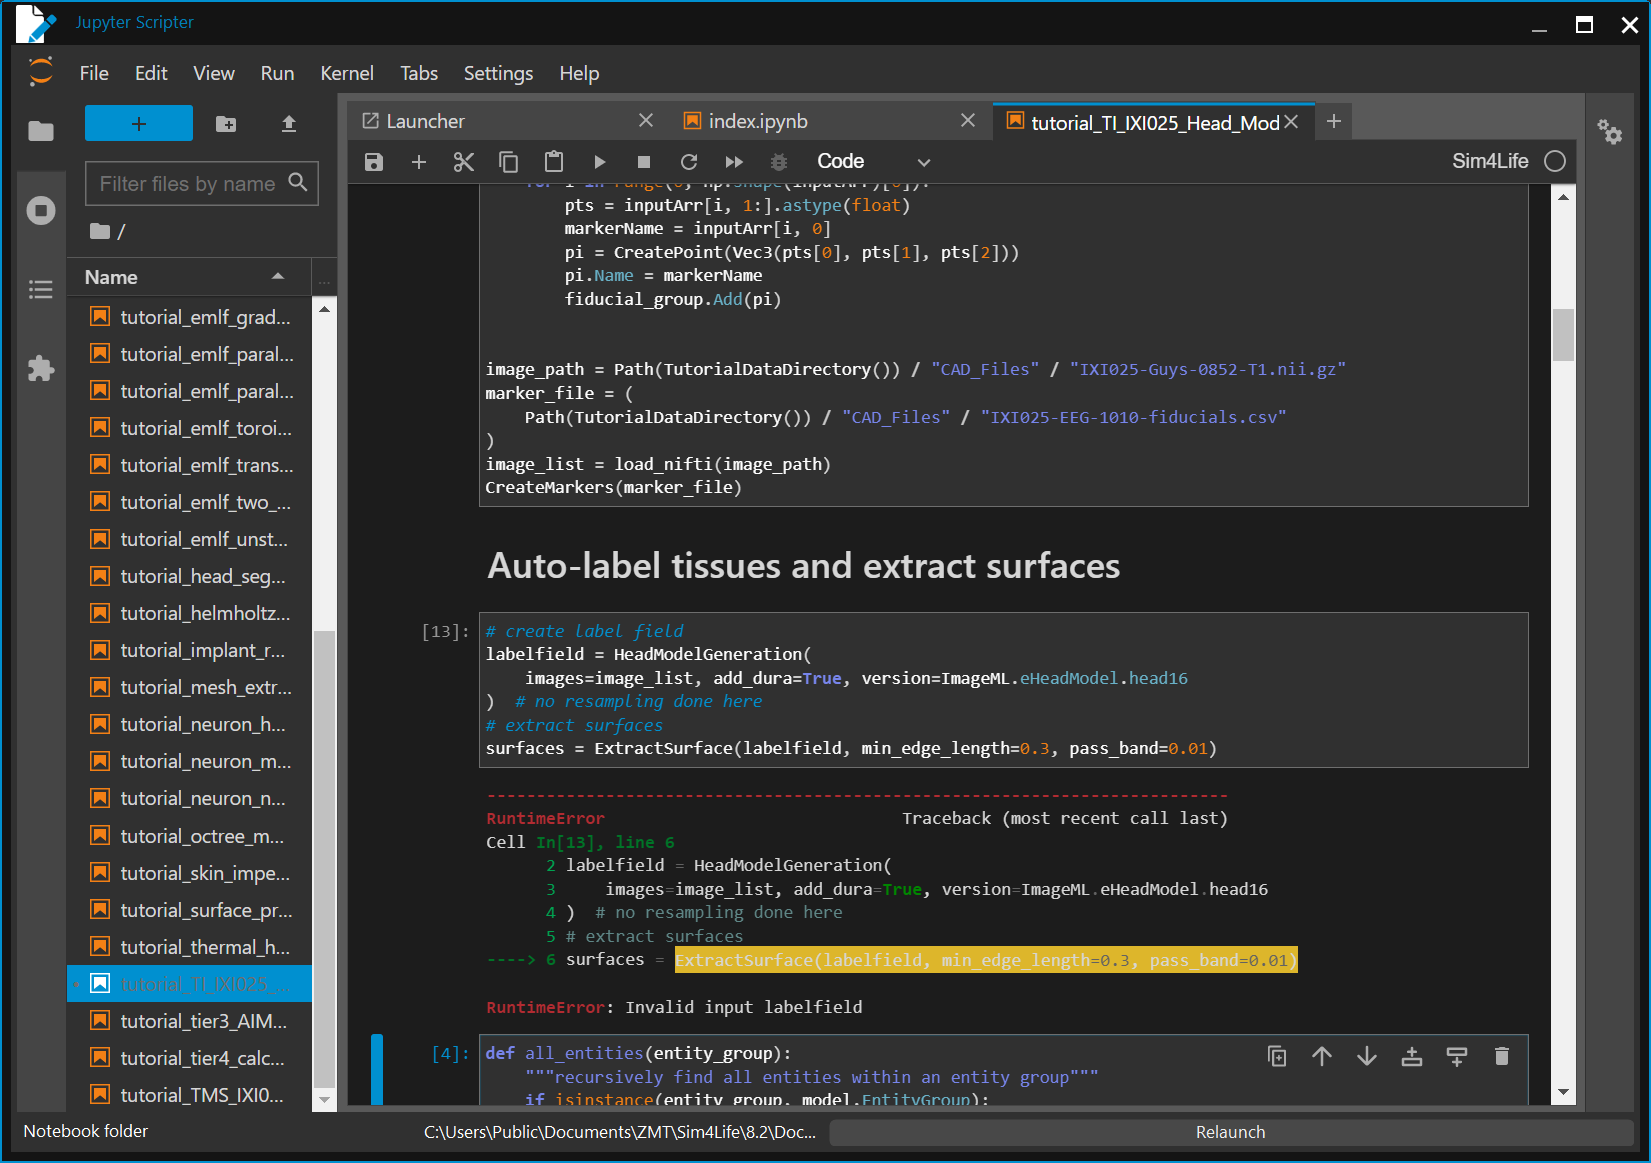
When I copy the file tutorial_TI_|X|025_head_model.ipynb into the CAD files folder of Sim4Life version 8.2.0.16876 and run it in this older version, most sections execute correctly, including the "Auto Label Tissues and Extract Surfaces" part. However, the script fails at the "Computing the Maximum Modulation Using the Masked Electric Fields" section with the following error:
AttributeError: module 's4l_v1.analysis.core' has no attribute 'MaxModAmpEvaluator'.
Could you please advise on how to resolve this issue? Thank you for your assistance.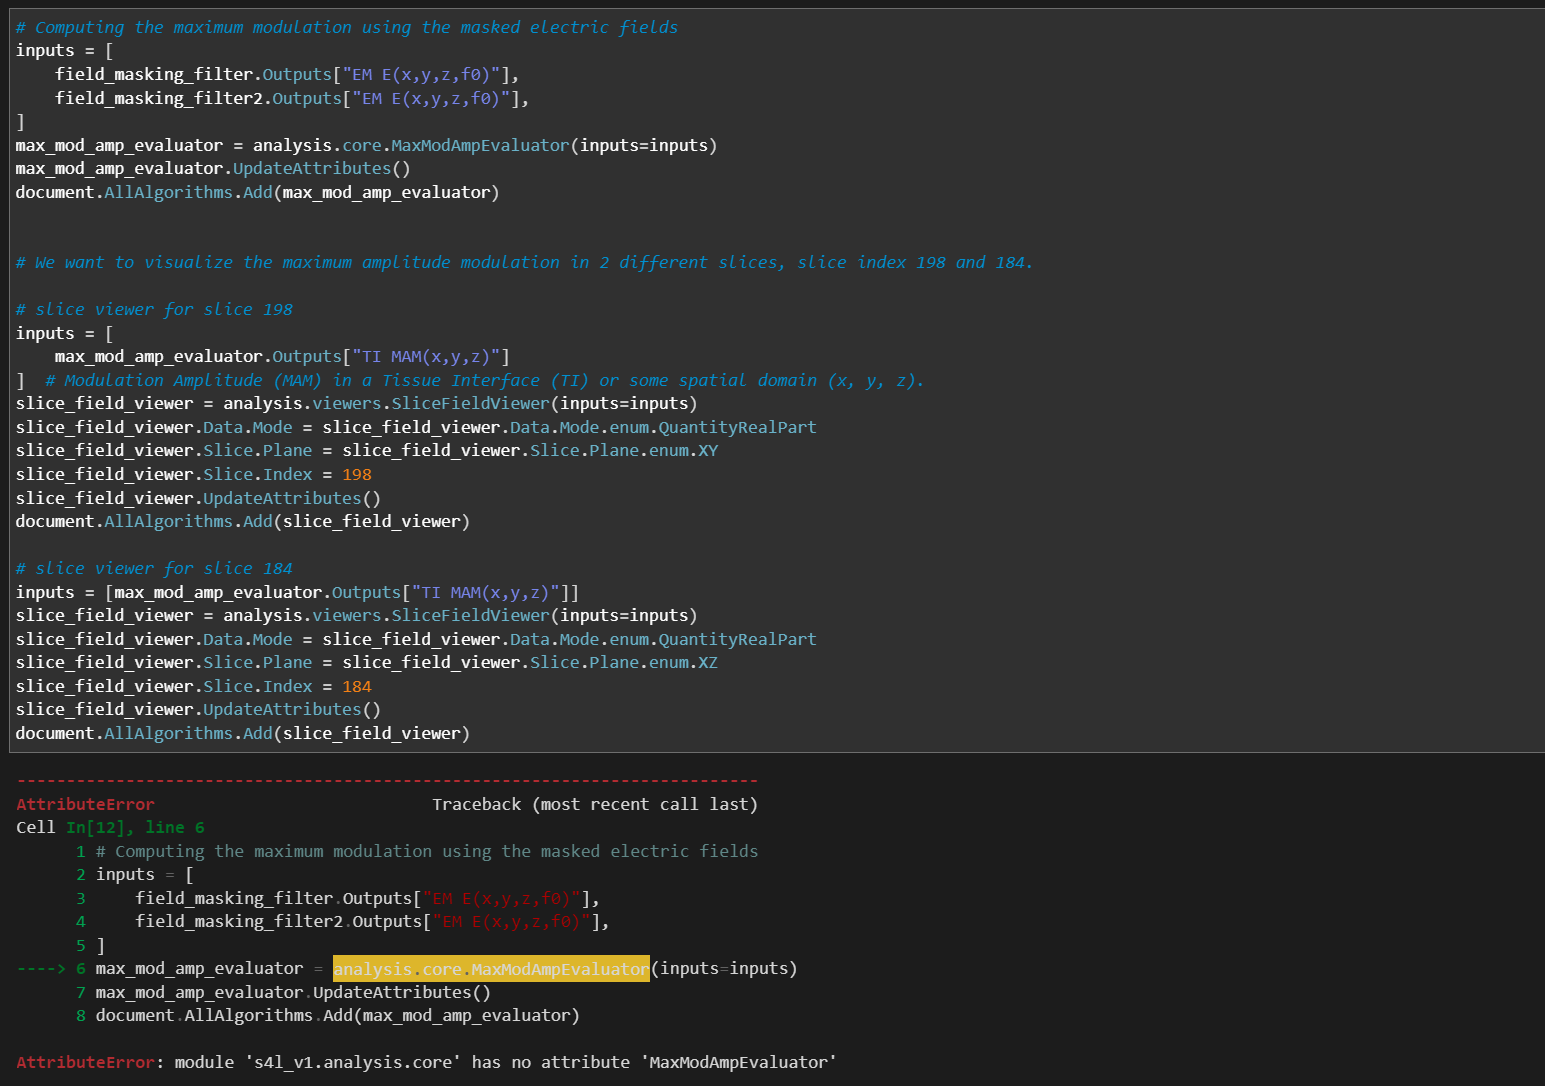
-
The error looks like something is wrong with the matplotlib package in your installation (the MPLBACKEND environment variable). Did you possibly install any python packages in Sim4Life's Python with 'pip'?
Can you run any other notebooks with matplotlib plots?
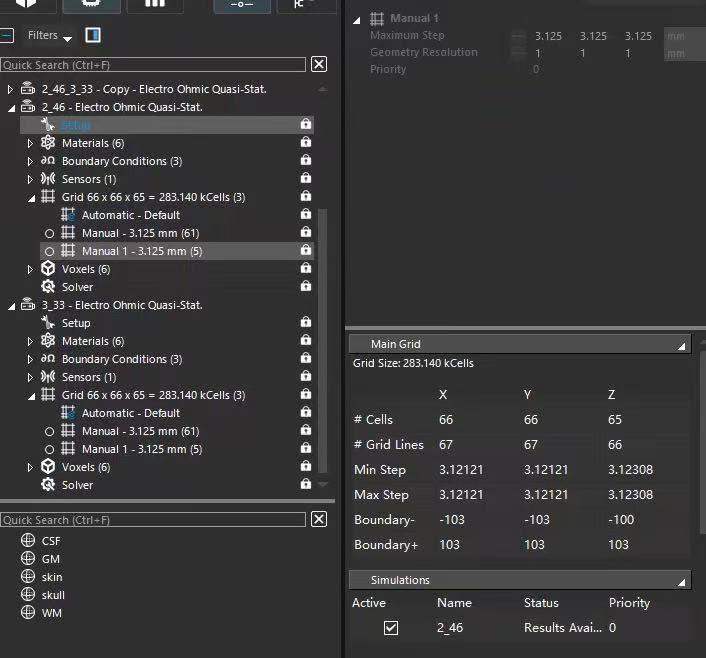
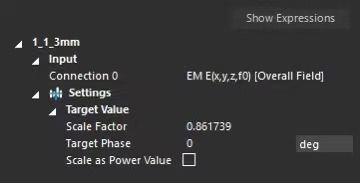
@bryn Hello, I am using a script to run TI simulations. I noticed that when I change the maximum grid step size for the electrodes and tissues from [2.0, 2.0, 2.0] to [3.125, 3.125, 3.125] in each simulation, the peak value of the calculated electric field (E-field) changes from 205 V/m to 445 V/m. Why does the grid step size affect the final calculated E-field value? Additionally, I found that changing the step size also significantly alters the Scale Factor used to normalize the results in each simulation. Here is the relevant code :
manual_grid_settings.MaxStep = numpy.array([3.125, 3.125, 3.125]), units.MilliMeters
manual_grid_settings.Resolution = numpy.array([1.0, 1.0, 1.0]), units.MilliMeter
-
Hi, @abbytang this is happening because in Sim4Life 8.2.2, due to internal environment changes the matplotlib default backend is set to: matplotlib_inline. The fix is to override the backend manually to a compatible one (Agg) early in the script. The fixed tutorial will be included in the v9 which will release soon. However, for now you can add this to the beginning of the script
"import os
os.environ["MPLBACKEND"] = "Agg"import matplotlib
matplotlib.use("Agg")"Please send an email to s4l-support@zmt.swiss and I can send you the updated jupyter notebook.
-
BTW. this is a temporary fix, which breaks inline plotting with matplotlib. We have fixed it in the release branch. A slightly improved workaround may be to temporarily unset the MPLBACKEND environment variable before the call to
HeadModelGeneration, e.g. something like thisimport os original_backend = os.environ.pop("MPLBACKEND", None) labelfield = HeadModelGeneration( images=image_list, add_dura=True, close_skin=True, close_csf=True, close_skull=True, version=ImageML.eHeadModel.head16, ) if original_backend is not None: os.environ["MPLBACKEND"] = original_backend
Hello! It looks like you're interested in this conversation, but you don't have an account yet.
Getting fed up of having to scroll through the same posts each visit? When you register for an account, you'll always come back to exactly where you were before, and choose to be notified of new replies (either via email, or push notification). You'll also be able to save bookmarks and upvote posts to show your appreciation to other community members.
With your input, this post could be even better 💗
Register Login