Padding field with constant value
-
Recently a user asked how they could extract a closed surface from a field, e.g. at the iso-value contour of a field distribution.
I answered that you can extract the iso-contour surface using the IsoSurfaceViewer.The problem was then that the iso-surface can be open, if the iso-value passes through the boundary. So I suggested to pad the field with a constant value (e.g. very small value) first, forcing the contour surface to be closed at the border.
But how can you pad a field using the Sim4Life api? Since this may be useful/interesting for other users I would like to share a snippet showing how this can be achieved:
import s4l_v1 as s4l
import s4l_v1.document as document
from s4l_v1 import Unit

import numpy as np


def create_rectilinear_field(nx: int, ny: int, nz: int, num_components: int = 1, cell_data: bool = True, value: float = 1.0):

    def make_quantity(name: str, unit: str):
        quantity = s4l.analysis.core.Quantity()
        quantity.Name = name
        quantity.Unit = Unit(unit)
        return quantity

    grid = s4l.analysis.core.RectilinearGrid()
    grid.XAxis = np.array(np.linspace(-0.15, 0.15, nx))
    grid.YAxis = np.array(np.linspace(-0.25, 0.25, ny))
    grid.ZAxis = np.array(np.linspace(-0.3, 0.3, nz))
    grid.Unit = Unit("m")

    num_tuples = (nx - 1) * (ny - 1) * (nz - 1) if cell_data else nx * ny * nz
    location = s4l.analysis.core.eValueLocation.kCellCenter if cell_data else s4l.analysis.core.eValueLocation.kNode

    field_data = s4l.analysis.core.FloatFieldData()
    field_data.Grid = grid
    field_data.ValueLocation = location
    field_data.Allocate(1, num_tuples, num_components)
    field_data.SetField(0, np.random.rand(num_tuples, num_components))
    field_data.Quantity = make_quantity("EM E(x,y,z,f0)", "V/m")
    field_data.SnapshotQuantity = make_quantity("Frequency", "Hz")
    field_data.Snapshots = [1000]
    return field_data


def pad_rectilinear_field(field_data: s4l.analysis.core.FieldData, pad_width: int = 1, value: float = 0.0, dx: float = 1e-3):
    grid = field_data.Grid
    assert isinstance(grid, s4l.analysis.core.RectilinearGrid)

    grid_padded = grid.Clone()
    grid_padded.XAxis = np.pad(grid.XAxis, pad_width=pad_width, mode="linear_ramp", end_values=(grid.XAxis[0]-dx, grid.XAxis[-1]+dx))
    grid_padded.YAxis = np.pad(grid.YAxis, pad_width=pad_width, mode="linear_ramp", end_values=(grid.YAxis[0]-dx, grid.YAxis[-1]+dx))
    grid_padded.ZAxis = np.pad(grid.ZAxis, pad_width=pad_width, mode="linear_ramp", end_values=(grid.ZAxis[0]-dx, grid.ZAxis[-1]+dx))

    data = field_data.Field(0)
    num_components = data.shape[1]
    nx, ny, nz = grid.XAxis.size, grid.YAxis.size, grid.ZAxis.size

    if field_data.ValueLocation == s4l.analysis.core.eValueLocation.kCellCenter:
        nx, ny, nz = nx - 1, ny - 1, nz - 1
    data = np.reshape(data, (nz, ny, nx, -1))
    data_padded = np.pad(data, pad_width=[(pad_width,), (pad_width,), (pad_width,), (0,)], mode="constant", constant_values=value)
    nx_padded, ny_padded, nz_padded = nz+2*pad_width, ny+2*pad_width, nx+2*pad_width
    data_padded = data_padded.reshape((-1, num_components))

    field_padded = field_data.Clone()
    field_padded.Grid = grid_padded
    field_padded.Allocate(1, nx_padded * ny_padded * nz_padded, num_components)
    field_padded.SetField(0, data_padded)
    return field_padded


if __name__ == "__main__":
    field = create_rectilinear_field(20, 23, 29, 1, True)
    field_padded = pad_rectilinear_field(field, 1, 0.0, dx=0.2)

    source = s4l.analysis.core.TrivialProducer()
    source.AddDataObject(field)
    source.AddDataObject(field_padded)
    document.AllAlgorithms.Add(source)
This is what it would like in a slice field viewer:
before padding: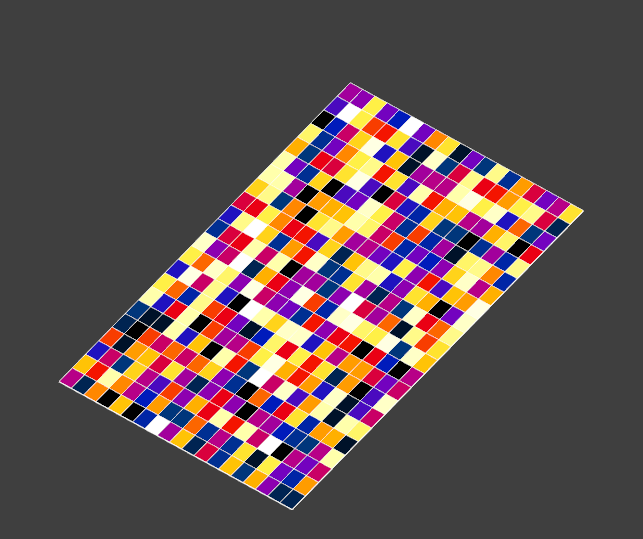
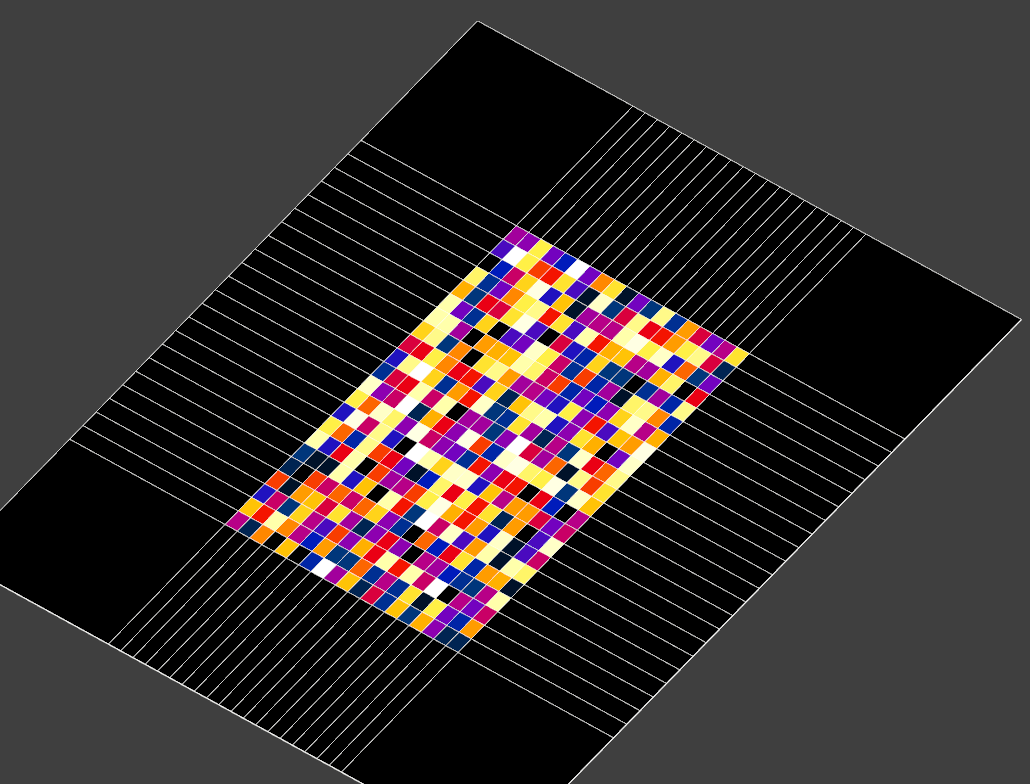
after padding:
Hello! It looks like you're interested in this conversation, but you don't have an account yet.
Getting fed up of having to scroll through the same posts each visit? When you register for an account, you'll always come back to exactly where you were before, and choose to be notified of new replies (either via email, or push notification). You'll also be able to save bookmarks and upvote posts to show your appreciation to other community members.
With your input, this post could be even better 💗
Register Login