Max modulation tool logic
-
How does the Max Modulation tool calculate the maximum modulation of two electric fields? I am asking since it is not described in the manual and it also does not appear in any of the tutorials.
Based on the this post, the tool is based on the formula derived in the Grossman et al., 2017 paper which is the following: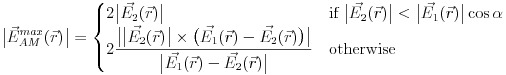
I applied this formula and the results I got were not correct when post-processing the two electric fields in Python, outside of Sim4Life. The above formula is for the |E_1| > |E_2| area. The code that I am using in Python is:
import numpy as np
import scipy.io as io

base_data = io.loadmat('Directory of extracted mat file for the simulation 1')
delta_data = io.loadmat('Directory of extracted mat file for the simulation 2')

e_field_1 = np.nan_to_num(base_data['EM_E_x_y_z_f0_Snapshot0'])
e_field_2 = np.nan_to_num(delta_data['EM_E_x_y_z_f0_Snapshot0'])

# Calculate the subtraction and addtion of the vectors
E_plus = np.add(e_field_1, e_field_2) # Create the sum of the E fields
E_minus = np.subtract(e_field_1, e_field_2) # Create the difference of the E fields

# Calculate the angles between the two fields for each vector
# Assuming that E_a is the difference of the vectors
dot_angle = np.einsum('ij,ij->i', e_field_1, E_minus)
cross_angle = np.linalg.norm(np.cross(e_field_1, E_minus), axis=1)

angles = np.arctan2(cross_angle, dot_angle)

# Condition to have two times the E2 field amplitude
max_condition = np.linalg.norm(e_field_2, axis=1) < np.linalg.norm(e_field_1, axis=1)*np.cos(angles)

e1_gr_e2 = np.where(np.linalg.norm(e_field_1, axis=1) > np.linalg.norm(e_field_2, axis=1), max_condition, False)

# Calculate the maximum envelope
envelope = np.where(e1_gr_e2, 2.0*np.linalg.norm(e_field_2, axis=1), envelope)

# Find the other points where the condition is not true
tmp = np.logical_xor(e1_gr_e2, np.linalg.norm(e_field_1, axis=1) > np.linalg.norm(e_field_2, axis=1))
envelope = np.where(tmp, 2.0*(np.linalg.norm(np.cross(e_field_2, E_minus), axis=1)/np.linalg.norm(E_minus, axis=1)), envelope)

np.nan_to_num(envelope)
The resulting graphs can be seen in the figure below, with the calculations from the above code shown on the left-most image, results from Sim4Life shown in the middle and the common points between Sim4Life and Python calculations shown in the right-most image.
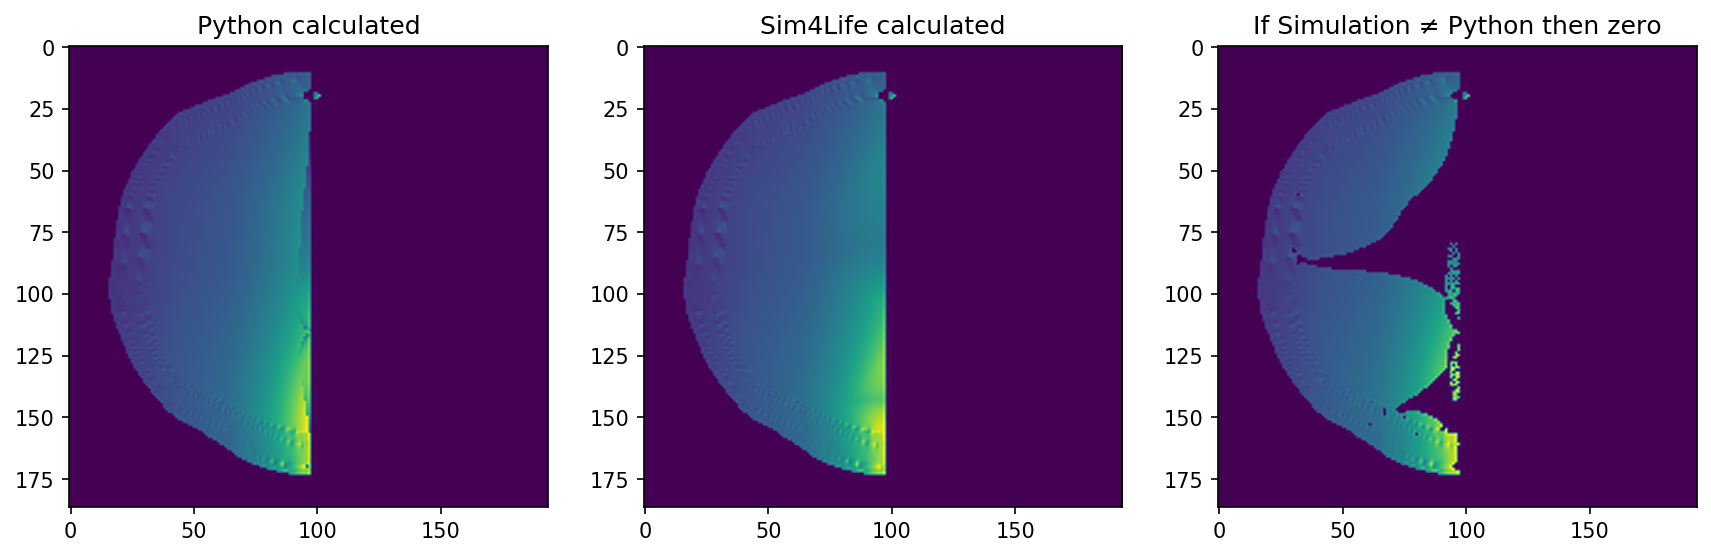
I have tried many variations of the code, setting the amplitudes of electric field on and two to double the value for all points and trying to find the common points and also tried different variations with the indices in the cross product formula. Still with all the variations I could not get all the points filled in the common points plot. The image with all calculated common points is shown below. The correct simulation image is also shown below.
Thank you!
-
Well.... after long time finally the solution has been found! Based on the Rampersad et al. 2019 where the mathematics behind the tTIS is better explained, the key line is that any of the two fields has to change direction whenever the angle between the two vectors is not less than 90 degrees. That was the magic line! Below I post the fully functional code as a python function. The arguments
e_field_1ande_field_2aren, 3arrays of the electric fields as produced by Sim4Life.def modulation_envelope(e_field_1, e_field_2, dir_vector=None): E_plus = np.add(e_field_1, e_field_2) # Create the sum of the E fields if dir_vector is None: envelope = np.zeros(e_field_1.shape[0]) # Calculate the angles between the two fields for each vector dot_angle = np.einsum('ij,ij->i', e_field_1, e_field_2) cross_angle = np.linalg.norm(np.cross(e_field_1, e_field_2), axis=1) angles = np.arctan2(cross_angle, dot_angle) # Flip the direction of the electric field if the angle between the two is greater or equal to 90 degrees e_field_2 = np.where(np.broadcast_to(angles >= np.pi/2., (3, e_field_2.shape[0])).T, -e_field_2, e_field_2) # Recalculate the angles dot_angle = np.einsum('ij,ij->i', e_field_1, e_field_2) cross_angle = np.linalg.norm(np.cross(e_field_1, e_field_2), axis=1) angles = np.arctan2(cross_angle, dot_angle) E_minus = np.subtract(e_field_1, e_field_2) # Create the difference of the E fields # Condition to have two times the E2 field amplitude max_condition = np.linalg.norm(e_field_2, axis=1) < np.linalg.norm(e_field_1, axis=1)*angs e1_gr_e2 = np.where(np.linalg.norm(e_field_1, axis=1) > np.linalg.norm(e_field_2, axis=1), max_condition, False) # Condition to have two times the E1 field amplitude max_condition_2 = np.linalg.norm(e_field_1, axis=1) < np.linalg.norm(e_field_2, axis=1)*angs e2_gr_e1 = np.where(np.linalg.norm(e_field_2, axis=1) > np.linalg.norm(e_field_1, axis=1), max_condition_2, False) # Double magnitudes envelope = np.where(e1_gr_e2, 2.0*np.linalg.norm(e_field_2, axis=1), envelope) # 2E2 (First case) envelope = np.where(e2_gr_e1, 2.0*np.linalg.norm(e_field_1, axis=1), envelope) # 2E1 (Second case) # Cross product # Redifine e1_gr_e2 to match the area ouside where the max_condition is met e1_gr_e2 = np.where(np.linalg.norm(e_field_1, axis=1) > np.linalg.norm(e_field_2, axis=1), np.logical_not(max_condition), False) envelope = np.where(e1_gr_e2, 2.0*(np.linalg.norm(np.cross(e_field_2, E_minus), axis=1)/np.linalg.norm(E_minus, axis=1)), envelope) # (First case) e2_gr_e1 = np.where(np.linalg.norm(e_field_2, axis=1) > np.linalg.norm(e_field_1, axis=1), np.logical_not(max_condition_2), False) envelope = np.where(e2_gr_e1, 2.0*(np.linalg.norm(np.cross(-e_field_1, -E_minus), axis=1)/np.linalg.norm(-E_minus, axis=1)), envelope) # (Second case) else: envelope = np.abs(np.abs(np.dot(E_plus, dir_vector)) - np.abs(np.dot(E_minus, dir_vector))) return envelope
Hello! It looks like you're interested in this conversation, but you don't have an account yet.
Getting fed up of having to scroll through the same posts each visit? When you register for an account, you'll always come back to exactly where you were before, and choose to be notified of new replies (either via email, or push notification). You'll also be able to save bookmarks and upvote posts to show your appreciation to other community members.
With your input, this post could be even better 💗
Register Login