Impedance plotting
-
Hello,
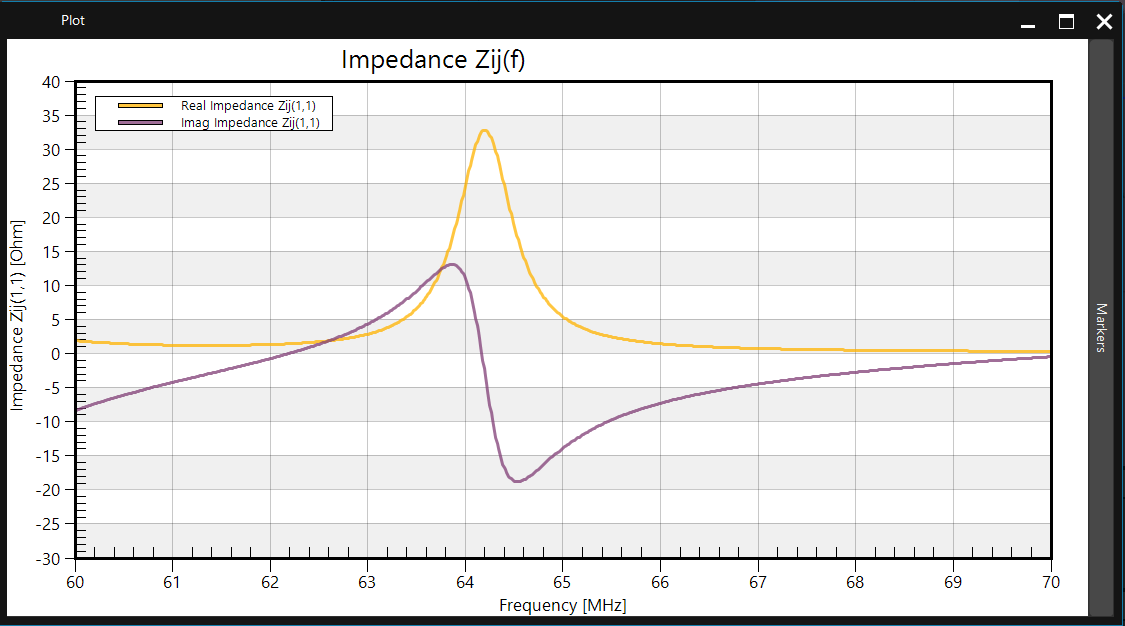
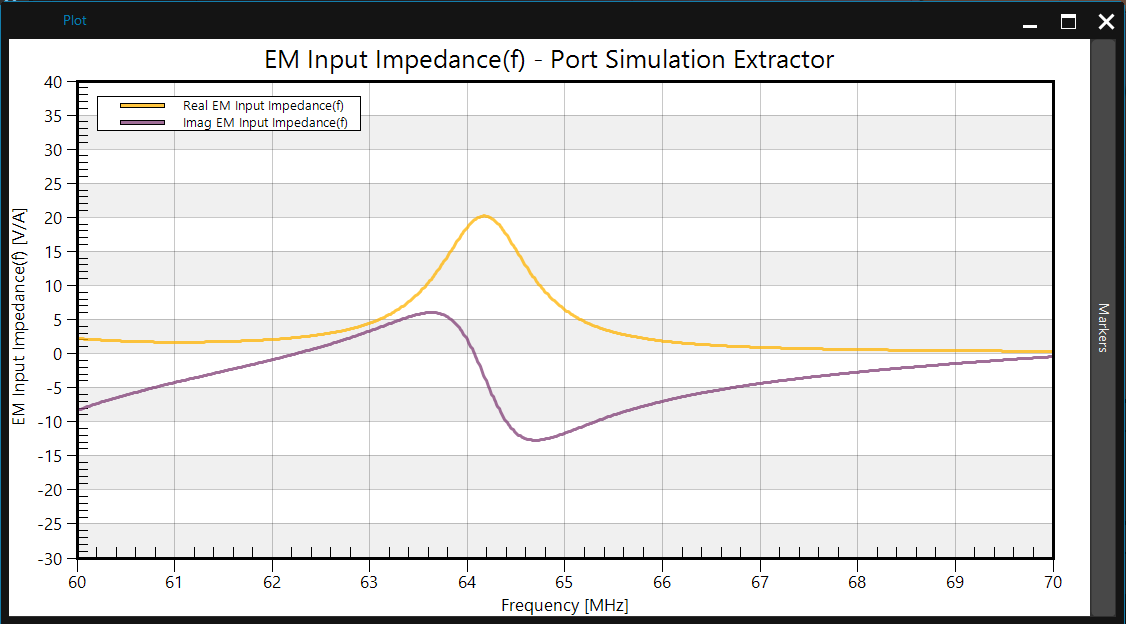
I'm working on a multiport simulation of a birdcage coil. I've done a few simulations already, but there's something I don't understand. I am using a high pass birdcage coil with two endring sources. I created a 2D impedance plot (Impedance Zij(f)) by clicking on Network Analysis – S Converter – Impedance Zij and then tried to create this plot by clicking on one of the sources by selecting Port Simulation Extractor-Sensor Extractor-EM Input Impedance(f). I thought that these two plots should look the same, but they don't, so I would like to ask for some clarification… Why are these two plots different? Am I missing something or is it some problem within my simulation?
Thanks in advance.
-
Hello,
I'm working on a multiport simulation of a birdcage coil. I've done a few simulations already, but there's something I don't understand. I am using a high pass birdcage coil with two endring sources. I created a 2D impedance plot (Impedance Zij(f)) by clicking on Network Analysis – S Converter – Impedance Zij and then tried to create this plot by clicking on one of the sources by selecting Port Simulation Extractor-Sensor Extractor-EM Input Impedance(f). I thought that these two plots should look the same, but they don't, so I would like to ask for some clarification… Why are these two plots different? Am I missing something or is it some problem within my simulation?
Thanks in advance.
Dear @Michael-0
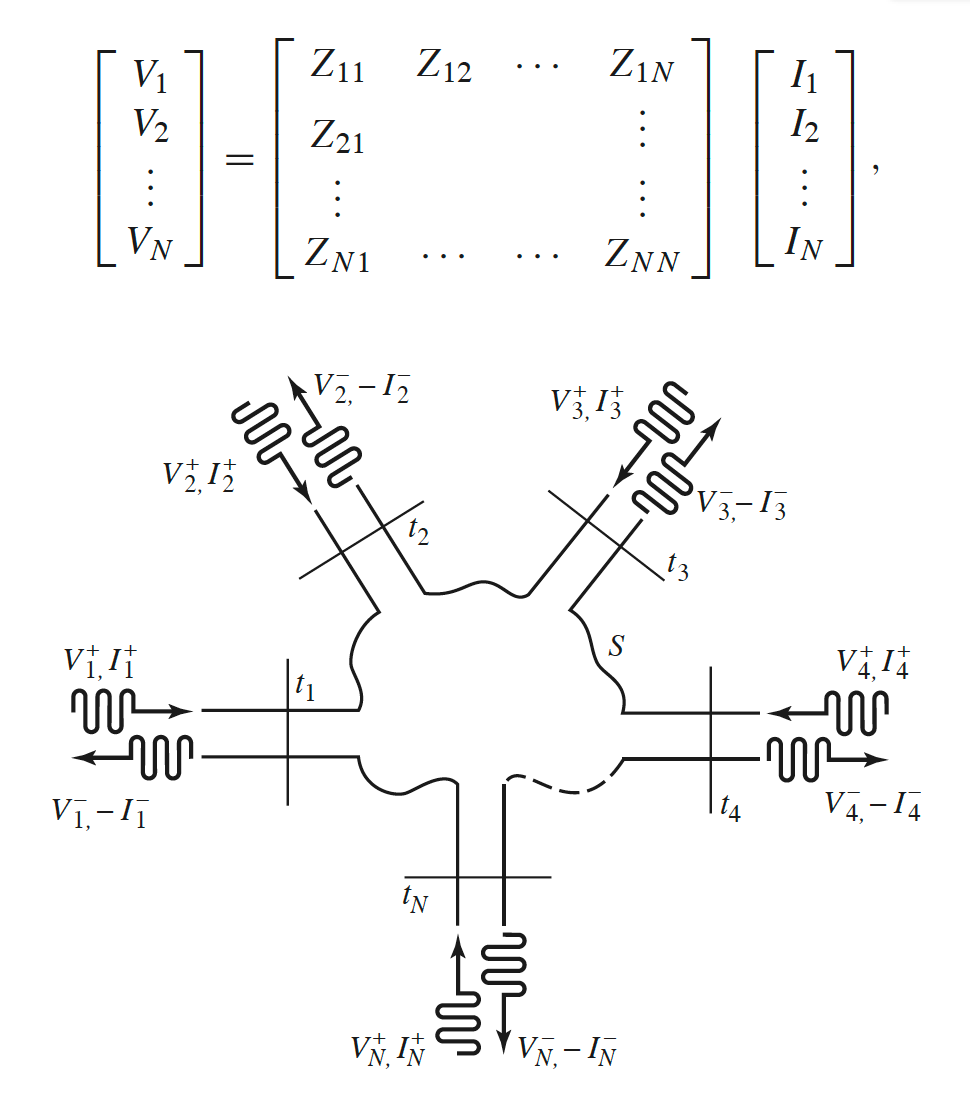
Please refer to books like Microwave Engineering by Pozar. The impedance matrix is defined as shown in the attached figure (from Pozar) and
Z_iiis the input impedance seen looking into port i when all other ports are open-circuited.