Skip to content
  • Search
Skins
  • Light
  • Cerulean
  • Cosmo
  • Flatly
  • Journal
  • Litera
  • Lumen
  • Lux
  • Materia
  • Minty
  • Morph
  • Pulse
  • Sandstone
  • Simplex
  • Sketchy
  • Spacelab
  • United
  • Yeti
  • Zephyr
  • Dark
  • Cyborg
  • Darkly
  • Quartz
  • Slate
  • Solar
  • Superhero
  • Vapor

  • Default (No Skin)
  • No Skin
Collapse

ZMT zurich med tech

  1. Home
  2. Sim4Life
  3. Python API
  4. Error in TI tutorial

Error in TI tutorial

Scheduled Pinned Locked Moved Python API
19 Posts 4 Posters 2.0k Views 4 Watching
  • Oldest to Newest
  • Newest to Oldest
  • Most Votes
Reply
  • Reply as topic
Log in to reply
This topic has been deleted. Only users with topic management privileges can see it.
  • brynB Offline
    brynB Offline
    bryn
    ZMT
    wrote on last edited by
    #9

    Are you using the latest Sim4Life, v8.2.2.18061?

    1 Reply Last reply
    0
    • A Offline
      A Offline
      abbytang
      wrote on last edited by
      #10

      Yes, I'm currently using the latest Sim4Life version (v8.2.2.18061). I will also install version 8.2.0.16876 and test it again for comparison.

      1 Reply Last reply
      0
      • A Offline
        A Offline
        abbytang
        wrote on last edited by
        #11

        When I copy the file tutorial_TI_|X|025_head_model.ipynb into the CAD files folder of Sim4Life version 8.2.0.16876 and run it in this older version, most sections execute correctly, including the "Auto Label Tissues and Extract Surfaces" part. However, the script fails at the "Computing the Maximum Modulation Using the Masked Electric Fields" section with the following error:
        AttributeError: module 's4l_v1.analysis.core' has no attribute 'MaxModAmpEvaluator'.
        Could you please advise on how to resolve this issue? Thank you for your assistance.
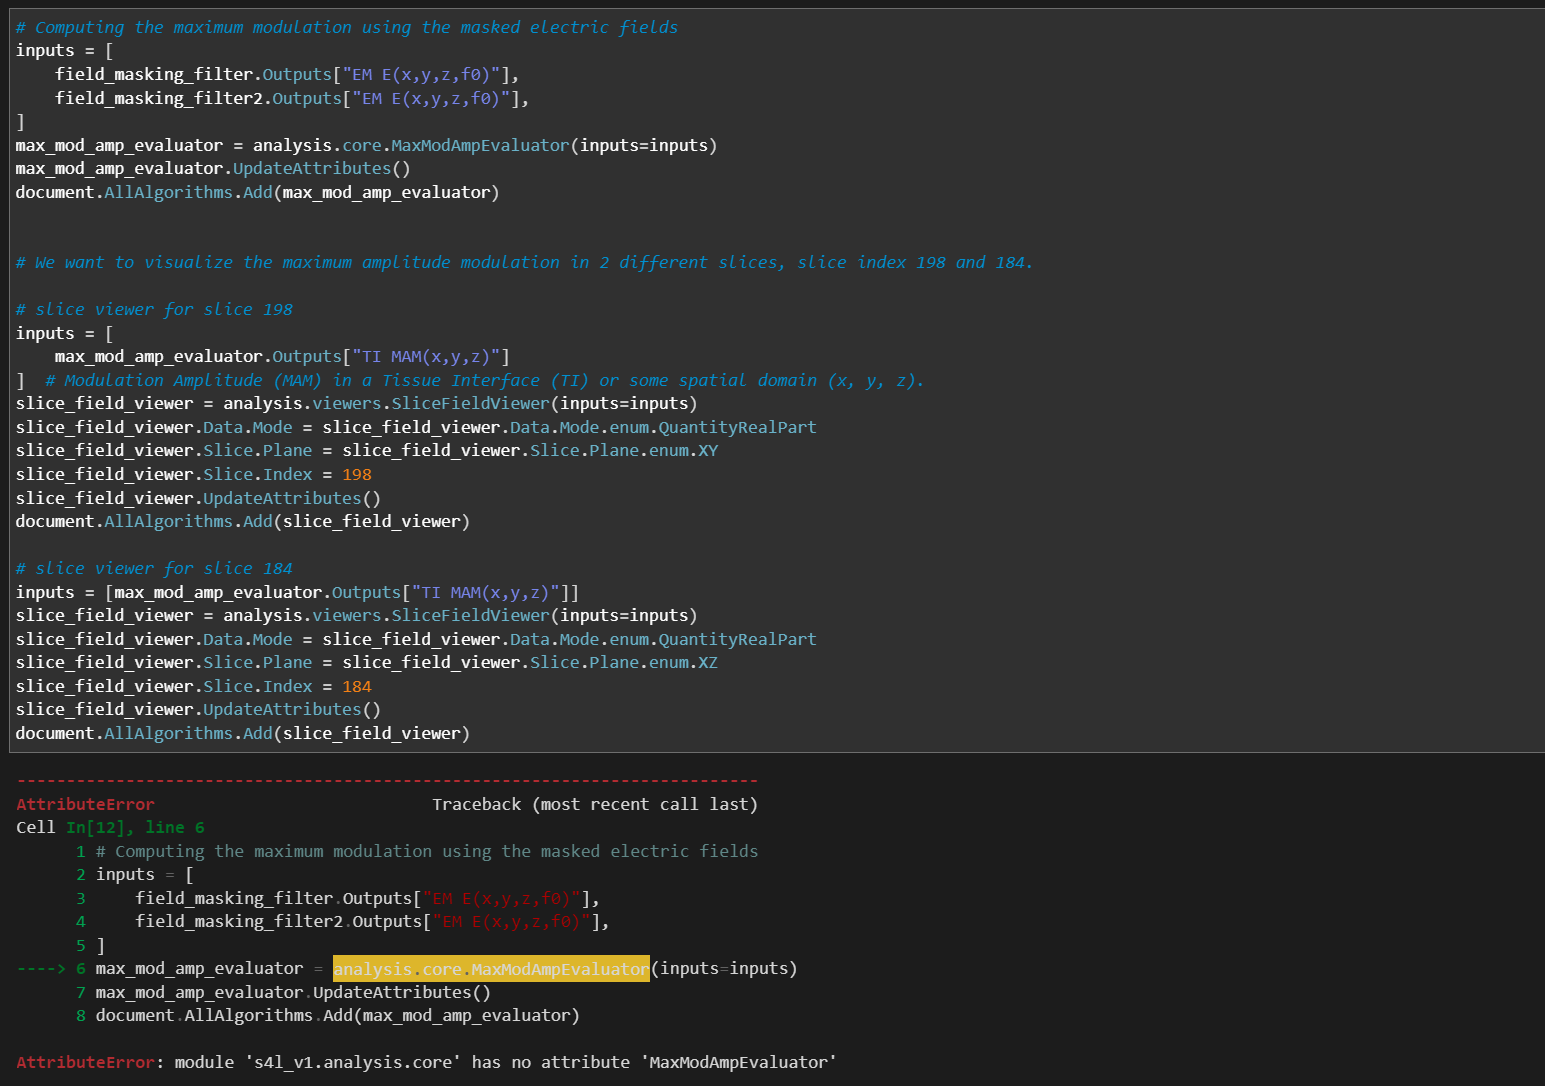
        image.png

        1 Reply Last reply
        0
        • brynB Offline
          brynB Offline
          bryn
          ZMT
          wrote on last edited by
          #12

          the MaxModAmpEvaluator was exposed in s4l_v1 6 months ago, so after 8.2.0.16876. You could probably use it though via the 'raw api': XPostProcessor.MaxModAmpEvaluator.

          1 Reply Last reply
          0
          • brynB bryn

            The error looks like something is wrong with the matplotlib package in your installation (the MPLBACKEND environment variable). Did you possibly install any python packages in Sim4Life's Python with 'pip'?

            Can you run any other notebooks with matplotlib plots?

            L Offline
            L Offline
            lucky_lin
            wrote last edited by
            #13

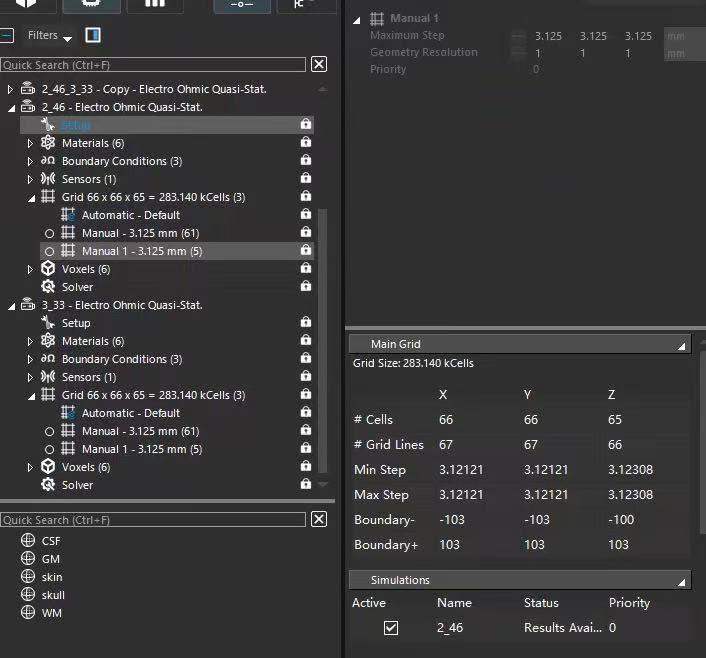
            @bryn Hello, I am using a script to run TI simulations. I noticed that when I change the maximum grid step size for the electrodes and tissues from [2.0, 2.0, 2.0] to [3.125, 3.125, 3.125] in each simulation, the peak value of the calculated electric field (E-field) changes from 205 V/m to 445 V/m. Why does the grid step size affect the final calculated E-field value? Additionally, I found that changing the step size also significantly alters the Scale Factor used to normalize the results in each simulation. Here is the relevant code :
            manual_grid_settings.MaxStep = numpy.array([3.125, 3.125, 3.125]), units.MilliMeters
            manual_grid_settings.Resolution = numpy.array([1.0, 1.0, 1.0]), units.MilliMeter
            26caa43b-1a9f-471a-bcac-c9f094e6b7ac-f7133268edf385e3629f1eb84541ed1.jpg
            56231949-d3bd-42c7-8b1a-da663561de5e-c6a39d9569d9d76c852280466adfcea.jpg

            1 Reply Last reply
            0
            • brynB Offline
              brynB Offline
              bryn
              ZMT
              wrote last edited by
              #14

              @lucky_lin Please post your question as a separate thread. This is unrelated to the topic of this thread. Thanks

              1 Reply Last reply
              0
              • brynB Offline
                brynB Offline
                bryn
                ZMT
                wrote last edited by
                #15

                @abbytang I can reproduce your issue in v8.2.2.18061. Investigating what is causing it and what workaround i can offer (except for reverting to the previous version). Sorry for the inconvenience.

                1 Reply Last reply
                0
                • A Offline
                  A Offline
                  abbytang
                  wrote last edited by
                  #16

                  Thank you for your help. I will run it in a previous version.

                  1 Reply Last reply
                  0
                  • H Offline
                    H Offline
                    halder
                    ZMT
                    wrote last edited by
                    #17

                    Hi, @abbytang this is happening because in Sim4Life 8.2.2, due to internal environment changes the matplotlib default backend is set to: matplotlib_inline. The fix is to override the backend manually to a compatible one (Agg) early in the script. The fixed tutorial will be included in the v9 which will release soon. However, for now you can add this to the beginning of the script
                    "import os
                    os.environ["MPLBACKEND"] = "Agg"

                    import matplotlib
                    matplotlib.use("Agg")"

                    Please send an email to s4l-support@zmt.swiss and I can send you the updated jupyter notebook.

                    1 Reply Last reply
                    1
                    • A Offline
                      A Offline
                      abbytang
                      wrote last edited by
                      #18

                      Thank you. It can work right now.

                      1 Reply Last reply
                      0
                      • brynB Offline
                        brynB Offline
                        bryn
                        ZMT
                        wrote last edited by
                        #19

                        BTW. this is a temporary fix, which breaks inline plotting with matplotlib. We have fixed it in the release branch. A slightly improved workaround may be to temporarily unset the MPLBACKEND environment variable before the call to HeadModelGeneration, e.g. something like this

                        import os
                        
                        original_backend = os.environ.pop("MPLBACKEND", None)
                        labelfield = HeadModelGeneration(
                            images=image_list,
                            add_dura=True,
                            close_skin=True,
                            close_csf=True,
                            close_skull=True,
                            version=ImageML.eHeadModel.head16,
                        )
                        if original_backend is not None:
                            os.environ["MPLBACKEND"] = original_backend
                        1 Reply Last reply
                        0
                        Reply
                        • Reply as topic
                        Log in to reply
                        • Oldest to Newest
                        • Newest to Oldest
                        • Most Votes


                        • Login

                        • Don't have an account? Register

                        • Login or register to search.
                        • First post
                          Last post
                        0
                        • Search