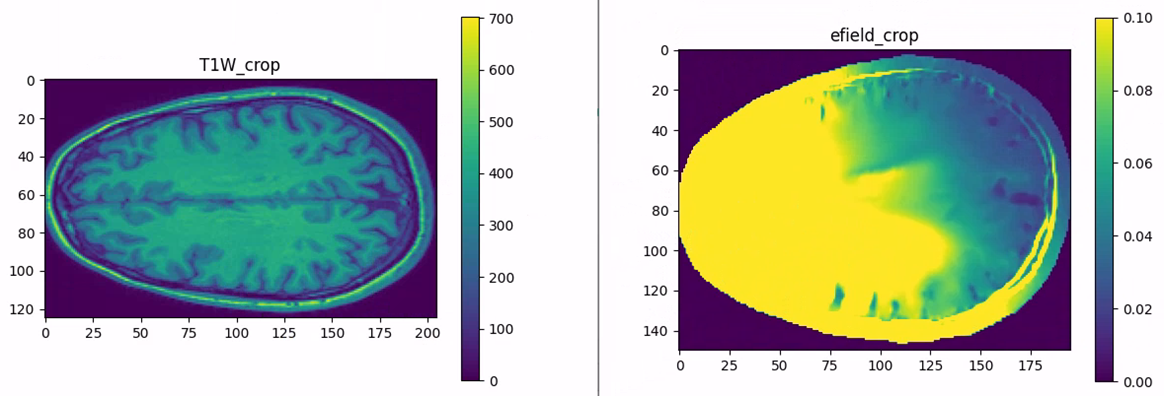
The shape of the T1 image and the shape of the electric field are different
-
I used the IXI025-Guys-0852-T1 image for head segmentation and then performed TI (tissue imaging) simulation. However, I found that the shape of the T1 image and the shape of the electric field are different. My simulation grid setting is 1 mm. Why is this the case?
-
You don't have the same resolution (grid spacing) in the T1 image and the efield...!
To visualize the two "fields" on the same grid, drag the T1w image to the analysis explorer, and interpolate it on the e-field grid.The interpolator has two inputs:
- T1w image (input field)
- E-field (target grid)
Here is a snippet to show this could be done in Python
import s4l_v1.analysis as analysis
import s4l_v1.document as document
import s4l_v1.model as model

# Add a new ModelToGridFilter
inputs = []
model_to_grid_filter = analysis.core.ModelToGridFilter(inputs=inputs)
model_to_grid_filter.Name = "Image"
model_to_grid_filter.Entity = model.AllEntities()["T1w-image"]  # The model entity corresponding to the T1w-image
model_to_grid_filter.UpdateAttributes()

# Add a new SimulationExtractor
simulation = document.AllSimulations["EM"]
simulation_extractor = simulation.Results()

# Add a new EmSensorExtractor
em_sensor_extractor = simulation_extractor["Overall Field"]
em_sensor_extractor.FrequencySettings.ExtractedFrequency = u"All"

# Add a new FieldInterpolationFilter
inputs = [model_to_grid_filter.Outputs[""], em_sensor_extractor.Outputs["EM E(x,y,z,f0)"]]
field_interpolation_filter = analysis.core.FieldInterpolationFilter(inputs=inputs)
field_interpolation_filter.UpdateAttributes()
document.AllAlgorithms.Add(field_interpolation_filter)
Then you will have the same grid and array ordering, and can overlay the T1w image and the field (or display them side by side with identical aspect ratio).
Note if your simulation grid is not uniform, matplotlib will depict the anatomy in a distorted way.
Btw, you could also interpolate in the other direction ... -
what do you mean by "The T1 and the electric field seem to be in opposite directions along the x-axis"?
- the interpolated T1 image and the E-field?
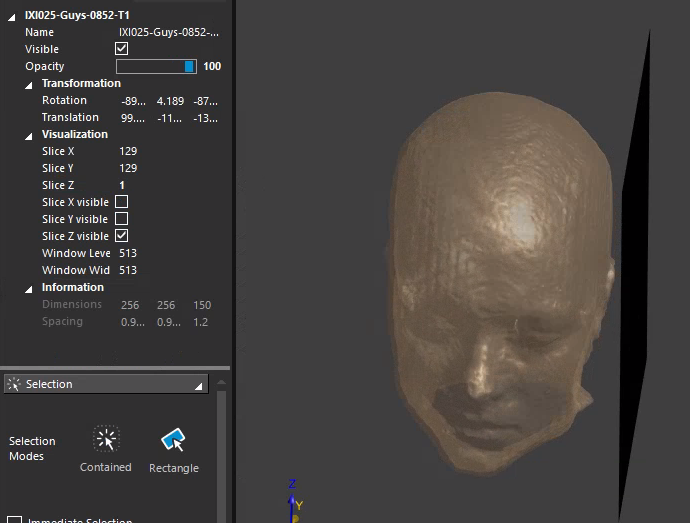
- is the interpolated T1 image NOT shown in the same position/orientation as the original T1 image from the modeler?
- is the original T1 image (which you imported in the modeler) aligned/shown in the same position/orientation as the model?
It would help if you would add screenshots to your question, with explanations of what each screenshot is trying to demonstrate.
-
what do you mean by "The T1 and the electric field seem to be in opposite directions along the x-axis"?
- the interpolated T1 image and the E-field?
- is the interpolated T1 image NOT shown in the same position/orientation as the original T1 image from the modeler?
- is the original T1 image (which you imported in the modeler) aligned/shown in the same position/orientation as the model?
It would help if you would add screenshots to your question, with explanations of what each screenshot is trying to demonstrate.
@bryn What I mean is that the slice with index 0 in the T1 image and the slice with index 1 in the electric field are not on the same side of the head model along the x-axis. Additionally, I would like to know if it is possible to export the interpolated T1 image. I need the T1 structural image that corresponds to the simulated electric field to create a dataset.
-
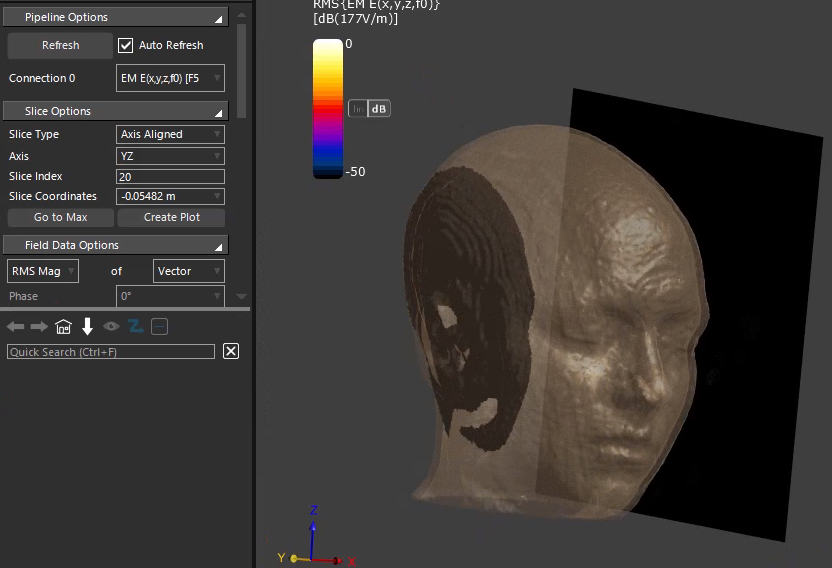
but are you using a slice field viewer to show the interpolated MRI slice? If not you basically are looking at the original MRI, with different grid and data ordering.
-
I sent you code (it can also be done in GUI) above to interpolate the T1w image onto the E-field/simulation grid. If you do that you can export it in the same format as you export the E-field (not as a nii.gz file, since the simulation grid is rectilinear which is not supported by nifti files).
-
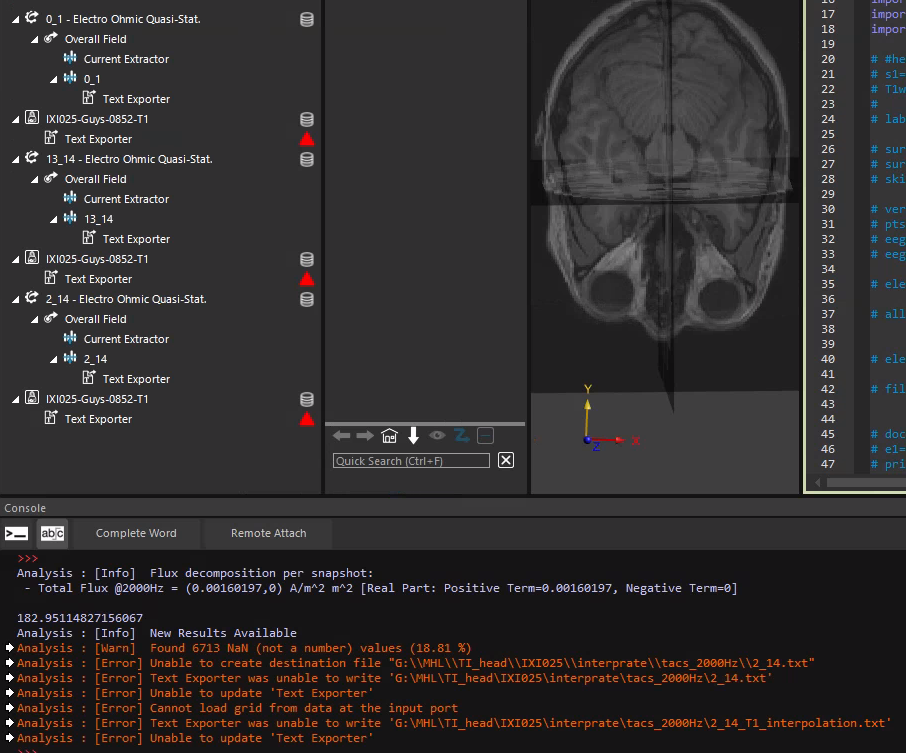
@bryn Is the following code correct? I'm not sure if the input is correct.
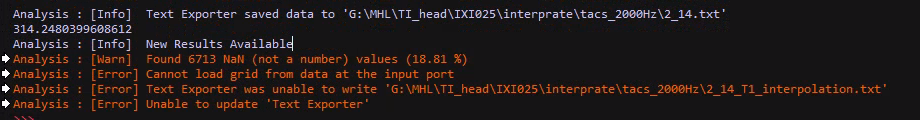
inputs1 = [model_to_grid_filter.Outputs[""]] field_data_text_exporter1 = analysis.exporters.FieldDataTextExporter(inputs=inputs1) field_data_text_exporter1.FileName = output_file1 field_data_text_exporter1.UpdateAttributes() document.AllAlgorithms.Add(field_data_text_exporter1) field_data_text_exporter1.Update(overwrite=True) -
this does not include the interpolation...
to access an output of an analysis algorithm you can use named outputs or indexed outputs, in your snippet above it may be easier to use the index '0'.
inputs1 = [model_to_grid_filter.Outputs[0]] -
what does your code look like? I create the pipeline in the GUI and it seems to run fine for me (v9.0.0). The "To Python" function yields
# This script was auto-generated by Sim4Life version 9.0.1 import numpy import s4l_v1.analysis as analysis import s4l_v1.document as document import s4l_v1.model as model import s4l_v1.units as units from s4l_v1 import ReleaseVersion from s4l_v1 import Unit try: # Define the version to use for default values ReleaseVersion.set_active(ReleaseVersion.version9_0) # Creating the analysis pipeline # Adding a new ModelToGridFilter inputs = [] model_to_grid_filter = analysis.core.ModelToGridFilter(inputs=inputs) model_to_grid_filter.Name = "IXI025-Guys-0852-T1" model_to_grid_filter.Entity = model.AllEntities()["IXI025-Guys-0852-T1"] model_to_grid_filter.UpdateAttributes() document.AllAlgorithms.Add(model_to_grid_filter) # Adding a new SimulationExtractor simulation = document.AllSimulations["EM"] simulation_extractor = simulation.Results() # Adding a new EmSensorExtractor em_sensor_extractor = simulation_extractor["Overall Field"] em_sensor_extractor.FrequencySettings.ExtractedFrequency = u"All" document.AllAlgorithms.Add(em_sensor_extractor) # Adding a new FieldInterpolationFilter inputs = [model_to_grid_filter.Outputs[0], em_sensor_extractor.Outputs["EM E(x,y,z,f0)"]] field_interpolation_filter = analysis.core.FieldInterpolationFilter(inputs=inputs) field_interpolation_filter.UpdateAttributes() document.AllAlgorithms.Add(field_interpolation_filter) # Adding a new FieldDataTextExporter inputs = [field_interpolation_filter.Outputs[""]] field_data_text_exporter = analysis.exporters.FieldDataTextExporter(inputs=inputs) field_data_text_exporter.FileName = u"D:\\temp\\ExportedFieldData-T1w.txt" field_data_text_exporter.UpdateAttributes() document.AllAlgorithms.Add(field_data_text_exporter) except Exception as exc: import traceback traceback.print_exc() # Reset active version to default ReleaseVersion.reset() raise(exc) -
 B bryn referenced this topic on
-
T tbone referenced this topic on
Hello! It looks like you're interested in this conversation, but you don't have an account yet.
Getting fed up of having to scroll through the same posts each visit? When you register for an account, you'll always come back to exactly where you were before, and choose to be notified of new replies (either via email, or push notification). You'll also be able to save bookmarks and upvote posts to show your appreciation to other community members.
With your input, this post could be even better 💗
Register Login