Skip to content
  • 0 Votes
    2 Posts
    27 Views
    C
    In answer to my own question, I found the way: Extract the Titration Evaluator via the Titration Sensor, and check the 'Visualize spikes' option in the Settings field for the Titration Evaluator. Click refresh; this will create a folder of point entities in the modelling window with all the nodes of first spike location. The locations of these point can be access using ent.Position in Python or Jupyter, which can then be used to calculate distances to other points. I will note for the SIM4LIFE team, I could not find any examples or documentation for this method, nor is the 'Visualize spikes' setting exposed in the API. Please consider adding this in a future update, as I believe it to be a powerful and useful method. It would also be helpful if these nodes are named distinctly, such that they correspond to the Neuron fibers that they refer to. This would mean that you don't end up with a significant number of entities all named 'node[0]'. Thanks!
  • 0 Votes
    1 Posts
    14 Views
    No one has replied
  • Python code for outputting analysis results

    Analysis & Postprocessing
    2
    0 Votes
    2 Posts
    96 Views
    B
    Hello, If you would just like to export the temperature distributions computed by the solver, you can use one of the built in Exporter tools (e.g. VTK, MATLAB, Text files), which produce formats that can be read externally. I would recommend that you do this manually first by using the GUI. Once you are satisfied with the configuration, you can right-click on your analysis tree and select 'To Python' to automatically generate the code required to reproduce the analysis. For example: import s4l_v1.analysis as analysis import s4l_v1.document as document # Incident EM parent simulation simulation = document.AllSimulations["EM Simulation Name"] simulation_extractor = simulation.Results() # Thermal simulation simulation = document.AllSimulations["Thermal Simulation Name"] simulation_extractor_2 = simulation.Results() # Choose a sensor to extract thermo_sensor_extractor = simulation_extractor_2["Overall Field"] document.AllAlgorithms.Add(thermo_sensor_extractor) # Adding a new MatlabExporter inputs = [thermo_sensor_extractor.Outputs["T(x,y,z,t)"]] matlab_exporter = analysis.exporters.MatlabExporter(inputs=inputs) matlab_exporter.FileName = u"C:\\Users\\Test\\Downloads\\myfile.mat" matlab_exporter.UpdateAttributes() document.AllAlgorithms.Add(matlab_exporter) # Call Update() to trigger writing the file matlab_exporter.Update() This will produce a .mat file that contains separate arrays for every 'Snapshot' in your thermal simulation. For transient thermal simulations, a snapshot represents the field distribution at some point in time. It is dependent on the 'Maximum No. Samples' option in the Sensor settings of the simulation configuration.
  • Extract EMLF Results via Jupyter

    Analysis & Postprocessing
    10
    0 Votes
    10 Posts
    3k Views
    K
    @bryn Excuse me for butting in. Nice to meet you. I’m currently a graduate student conducting research on temperature distribution in liver tumors with respiratory motion using Sim4Life. Could you please share some code that uses Python scripts to output the analysis results of temperature distributions after running the simulation?
  • 0 Votes
    2 Posts
    431 Views
    B
    Hi parsley, This is a known issue that is currently in our backlog. A fix will be included in a future release. Thank you for your feedback and your interest in the Sim4Life VSCode extension.
  • 0 Votes
    2 Posts
    267 Views
    C
    Hello, When you only use a single manual grid (0.7 mm) on the bounding box, the entire domain - including the electrodes - is discretized uniformly at that resolution. While 0.7 mm is reasonably fine, it may still be too coarse to accurately capture the very steep electric field gradients near the electrodes, especially for TI setups where interference patterns are sensitive to local field accuracy. When you enable Automatic Grid settings for the electrodes, the solver applies local mesh refinement around those electrode regions. This typically results in a smaller minimum step size near the electrodes than your global 0.7 mm grid. That improved resolution leads to more accurate current density and E-field calculations at the source, which then propagates into differences in the resulting interfering field. So the change you see is not an error - it’s actually a sign that the solution is sensitive to mesh resolution near the electrodes, which is expected. Regarding your other question: Using a bounding box vs. explicitly listing all head tissues generally does not change the result if the grid settings are identical, because the box already encloses all tissues. It’s mostly a workflow/simplicity choice. I hope this information helps.
  • Setting up up Flow-coupled Thermal Simulation

    T-Neuro
    1
    0 Votes
    1 Posts
    69 Views
    No one has replied
  • Regional Models - Lower Limb

    Anatomical Models
    3
    0 Votes
    3 Posts
    225 Views
    R
    Hello Silvia, Thank you for your reply and for clarifying this. Noted with thanks. Robert
  • Importing Billie_V2_skin_functionalized.sab in sim4life.lite

    T-Neuro
    2
    0 Votes
    2 Posts
    240 Views
    H
    Hi Jihan, you can access the file from here: https://outbox.zmt.swiss/halder/forum.zip
  • 0 Votes
    2 Posts
    216 Views
    M
    Hi, yes, we have new agent in China and the contact email is zmt_china@163.com.
  • 2 Votes
    5 Posts
    978 Views
    R
    thanks so much, appreciate it!
  • 0 Votes
    1 Posts
    109 Views
    No one has replied
  • Sim4Life V9.4 Release

    Announcements
    1
    0 Votes
    1 Posts
    256 Views
    No one has replied
  • 0 Votes
    3 Posts
    252 Views
    J
    Yes, I am working on sim4life.lite version Thank you very much bryn
  • Importing electrode positions recorded in RAS coordinates

    Python API
    3
    0 Votes
    3 Posts
    324 Views
    T
    @bryn Thank you for your detailed response! I had overlooked that Sim4Life loads images in LPS orientation, but using your function I was able to correctly place the electrodes at the intended coordinates. I was wondering as well, if I wanted to compute the resulting E-fields per ROI based on the Brainnetome Atlas (BNA), what would be the recommended way? Would it be better to: Interpolate the E-fields onto the T1w image like you have mentioned here https://forum.zmt.swiss/topic/735/the-shape-of-the-t1-image-and-the-shape-of-the-electric-field-are-different/18, then warp the BNA atlas into the subject's T1w space? Or Export the E-field as '.vtk', and then use the information directly to group field values according to atlas labels (labels are warped BNA-> subject): mesh = pv.read(r"MaxModulation_Efield.vtk") mesh_p = mesh.cell_data_to_point_data() # only cell data exists points = mesh_p.points * 1000 # mesh (m) to (mm) points_ras = points.copy() # LPS to RAS points_ras[:, 0] = -points[:, 0] # Left <-> Right points_ras[:, 1] = -points[:, 1] # Post <-> Ant # Mesh (world coords) to atlas voxel indices points_h = np.c_[points_ras, np.ones(len(points_ras))] voxels = (inv_affine @ points_h.T).T.astype(int) I would really appreciate your feedback on how to accurately compute this. Thank you again for your help!
  • 0 Votes
    2 Posts
    575 Views
    AntoninoMCA
    Hi @fangohr, this is a very important question, especially considering the strong electrical anisotropy of muscle tissue. Unfortunately, the whole-body anatomical models provided with Sim4Life do not include DTI information that could be used to assign anisotropic properties. Therefore, if you want to model tissue anisotropy, alternative approaches are required. Some of these may be reasonable when the stimulation is regional, i.e. limited to a small number of muscles. In principle, Sim4Life allows you to model heterogeneous tissue anisotropy in two main ways. 1) Using subject-specific DTI data If you are working with a personalized model (e.g. a head model) and have subject-specific DWI data, you can proceed as follows: a. Reconstruct the DTI data from the DWI, bvec, and bval files (all standard outputs of MRI DTI). b. Convert the DTI into a conductivity tensor field using the Tuch model [1] 
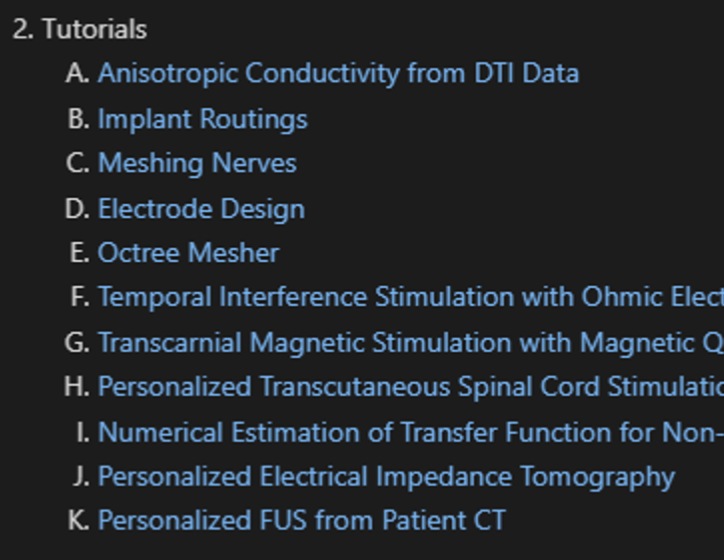
Both steps are fully implemented in Sim4Life. Step (1) is performed via the Python API (please refer to the “Anisotropic Conductivity Tutorial” in the Examples section), while step (2) can be executed either through the Python API or directly in the GUI. The attached animation shows how processed DTI data can be converted into tissue anisotropy data structure using the Tuch approach, and assigned to WM conductivity. 2) Without DTI data (assumption-based approach) - Using an E-field distribution & Cylindrical Tensor Model If DTI data are not available, an alternative approach is possible, but its validity is entirely your responsibility. Sim4Life allows you to create a conductivity tensor field from a 3D vector field by assuming cylindrical symmetry of the conductivity tensor. In this case, the principal tensor direction is assigned according to the local direction of the vector field, and only the longitudinal (parallel to the fibers) and radial (perpendicular to the fibers) conductivities need to be specified (you can find these values in the IT'IS LF Database (https://itis.swiss/virtual-population/tissue-properties/database/low-frequency-conductivity/) The input vector field can be, for example, an E-field computed with any EM solver in Sim4Life, or a vector field generated via the Python API. One possible strategy would be to create an E-field aligned with the muscle fibers. This requires assumptions about muscle fiber organization — for instance, that fibers follow a diffusion-like process and extend from tendon to tendon. Under such assumptions, fiber directions could be approximated using an E-field computed with the QS-Ohmic Current solver, where the muscle is modeled as a homogeneous tissue and the tendons at the extremities act as Dirichlet boundary conditions. Please note that this is not a ready-to-use recipe. This approach may be reasonable for certain muscles and unsuitable for others, and it represents a strong simplification of the underlying physiology. You will need to define a plausible fiber model and then use Sim4Life to test and validate your assumptions. I hope this helps. If you need further or more specific assistance, please feel free to write again or contact the Sim4Life support team directly. All the best, Antonino [1] Tuch, D. S., et al. Conductivity tensor mapping of the human brain using diffusion tensor MRI. Proceedings of the National Academy of Sciences, 98(20), 11697–11701 (2001). [image: 1769594990533-anisotropy_from_dti_4.gif]
  • 0 Votes
    4 Posts
    2k Views
    T
    hi,bryn. Upon discovering your post, I downloaded the latest software version—9.2.1.19976. However, I was unable to locate the H. Personalised Transcutaneous Spinal Cord Stimulator. Might you kindly advise where I might find this?@bryn
  • Using multiple sources in Neuron Simulation

    Unsolved Simulations & Solvers
    2
    0 Votes
    2 Posts
    491 Views
    C
    When you provide multiple EM-LF simulations as sources to the Neuron solver, the neuron effectively receives the sum of the extracellular fields/potentials generated by the individual simulations (assuming the same modulation pulse is used). This is expected behavior because EM-LF simulations are linear, and therefore their solutions can be superimposed. To verify this behavior, you can use the Field Combiner tool in Sim4Life: First, combine the EM-LF results using the Field Combiner, which applies linear superposition of the fields. Then, use the combined field as a single source for the Neuron simulation. If you compare this setup to a Neuron simulation where the individual EM-LF results are used as separate sources (with the same modulation pulse), the neuron response will be identical. This confirms that, internally, the Neuron solver is operating on the sum of the fields from the different EM-LF simulations. If additional verification is desired, the EM-LF fields can also be interpolated along the neuron spline (for each simulation individually and for the Field Combiner result) to explicitly confirm that the combined field corresponds to the pointwise sum of the individual fields. Note: the field combiner expects the fields to be at the same frequency. If you would like more information about a specific application, or if you would like to share your project with us to receive more targeted feedback, please do not hesitate to contact us at s4l-support@zmt.swiss.
  • 0 Votes
    3 Posts
    524 Views
    S
    Thanks for the suggestion. I will contact the licensing team at s4l-license@zmt.swiss with the relevant details and will update this thread once I receive their guidance.
  • Electro Ohmic Quasi-Stat Normalization

    Sim4Life
    2
    0 Votes
    2 Posts
    467 Views
    C
    When you use the normalization option, Sim4Life: Computes the current flux through an automatically generated iso-potential surface Scales all output quantities so that the resulting current matches the value specified in the Normalize Frequency-Domain Results field The current value you enter represents the phasor amplitude, i.e. the baseline-to-peak current. For more information, please refer to the Sim4Life Manual Section 2.13.7.3.3 Normalization -- Normalization to Current.